Page Navigation Report
 Overview
The purpose of this report is to investigate user navigation to/from a single page in
more detail than in site
navigation structure report. Details
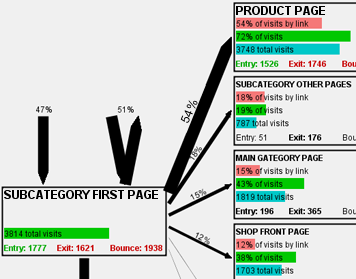
A Page Navigation Report shows the navigation in and out of page. Like in the site navigation structure report, the navigation is shown as percentage of visits. For example, the figure 54% in the arrow from "SUBCATEGORY FIRST PAGE" to "PRODUCT PAGE" on the left means exactly that 54% of those visitors that visited "SUBCATEGORY FIRST PAGE" used a link on that page to move to "PRODUCT PAGE", once or many times. This information is shown both for link leading to the page and for links leading from the page.The Page Navigation Report is centered on one page and it provides you all the details you need about how people navigate to and from that page on your site. This detail knowledge includes the Entrance, Exit and Bounce rates for the page. A Page Navigation Report can be produced from each individual page of the site.
When you want to know how your users behave on a certain page, Page Navigation Report gives you the information you need, in a clear visual format. See a full size sample report.
Comparing time periods
 When
comparing time
periods, the report again shows statistical
significance of the differences by stars. Significance
levels are *=95%, **=99% and ***=99.9%. This means for example that at
99% significance level, there is only 1% probability that the
difference could have occurred by chance, assuming that there is
certain random variability (that is normally distributed)
in the data. For interpreting the reports, this means at least that
when you get no stars at all, it is very likely that the difference is
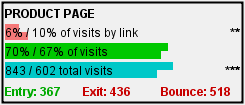
due to random variability in the data, like the 70% / 67% difference on
the left.
When
comparing time
periods, the report again shows statistical
significance of the differences by stars. Significance
levels are *=95%, **=99% and ***=99.9%. This means for example that at
99% significance level, there is only 1% probability that the
difference could have occurred by chance, assuming that there is
certain random variability (that is normally distributed)
in the data. For interpreting the reports, this means at least that
when you get no stars at all, it is very likely that the difference is
due to random variability in the data, like the 70% / 67% difference on
the left.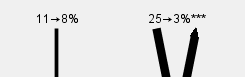 The same is
shown
for entrance
and bounce
arrows in the diagram. See full
version of a comparison analysis.
The same is
shown
for entrance
and bounce
arrows in the diagram. See full
version of a comparison analysis.